Yes. In BetterPPT the shape of a list or table, such as a timeline, a process, a cycle, an icon grid or a chart, can change in every content mode, as long as every item and every word stays: choosing keep every word means no item is dropped and no text is rewritten. Shortening long descriptions to fit a timeline is a different decision, made by the light-editing or restructuring modes. The example below is a real five-row table turned into a timeline: the title's subject, the five phase names and all five date ranges stayed identical, the long descriptions were condensed to one line each, and a new background was generated. The diagram is part of the slide picture with editable text on top, not a native PowerPoint SmartArt object.
- 01
Choose the shape from what the items do to each other
Items that happen in order are a timeline or a process. Items that repeat are a cycle. Parts of a whole are a hierarchy or a set of blocks. Independent points of equal rank are an icon grid. Two things being compared are two columns. A rule of thumb for any tool: four to six items read well on one line; more than that needs two rows or a different shape. When you give us a list, you do not have to name the shape, but it helps to say what the items are.
- 02
Real example: a five-row table became a timeline
The original is a plain table: five phases of a retreat development, each with dates, a theme and a long description. After the redesign the five phases sit on one line. We compared the two slides: the title's subject, the five phase names and all five date ranges are identical. The long descriptions were shortened to one line each, the title was rewritten as a single sentence, “Bringing Cedar Ridge Retreat to life in five phases”, and the forest background is newly generated. If you need every description word for word, choose keep every word; the layout then has to make room for the full text.
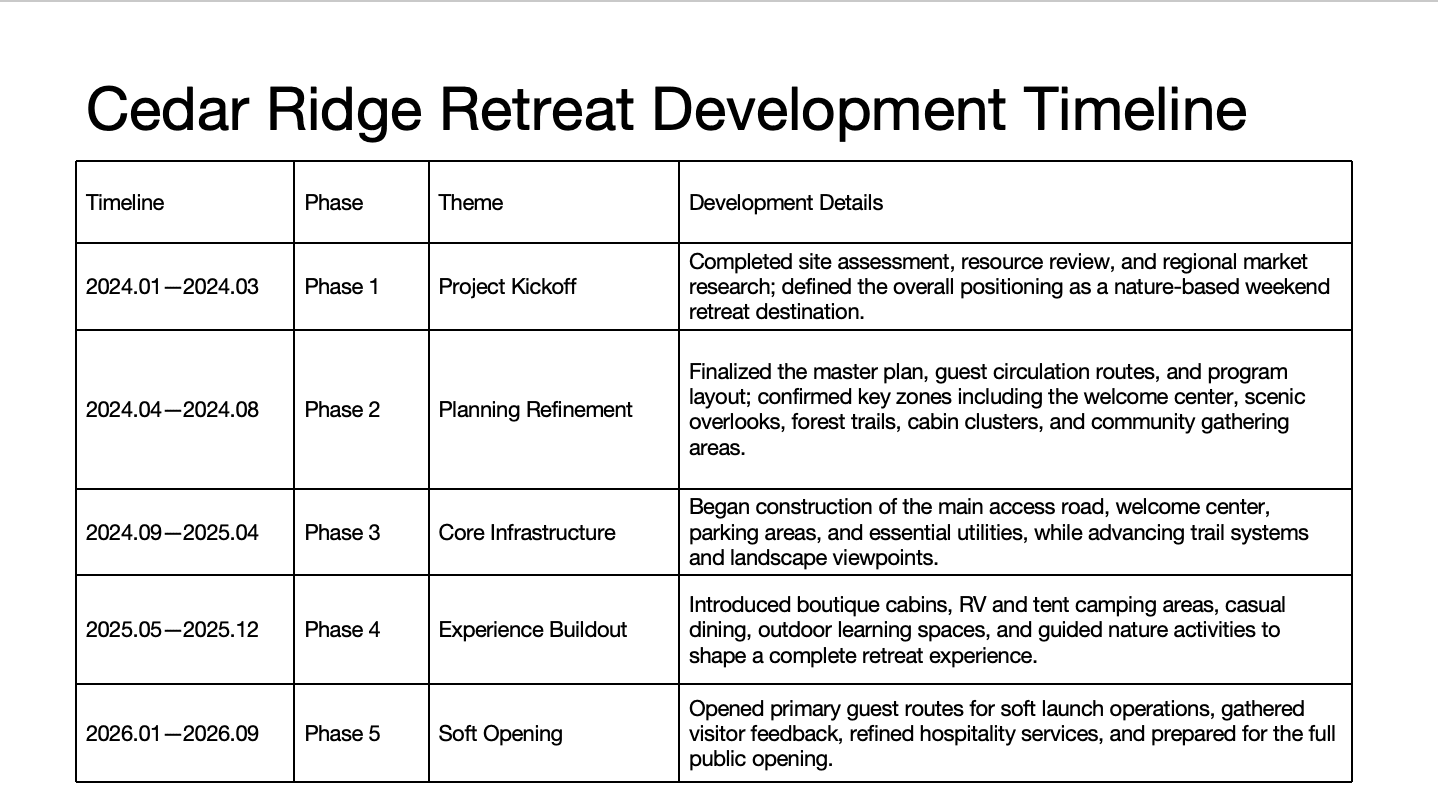
Before: a five-row table with long descriptions 
After: the same five phases and dates on one line, descriptions condensed - 03
Real example: a table of percentages became one chart
A table makes the reader do the comparison. In this example five countries' economic-confidence figures were turned into one diverging bar chart with a conclusion headline. We compared every cell: all 20 percentages match the original. What is new: the headline, which states a conclusion and is our reading of the data; the rows are reordered by how many respondents answered strong; and the last legend label was shortened. Check new words like these yourself before you present.
How to make charts and tables easier to read →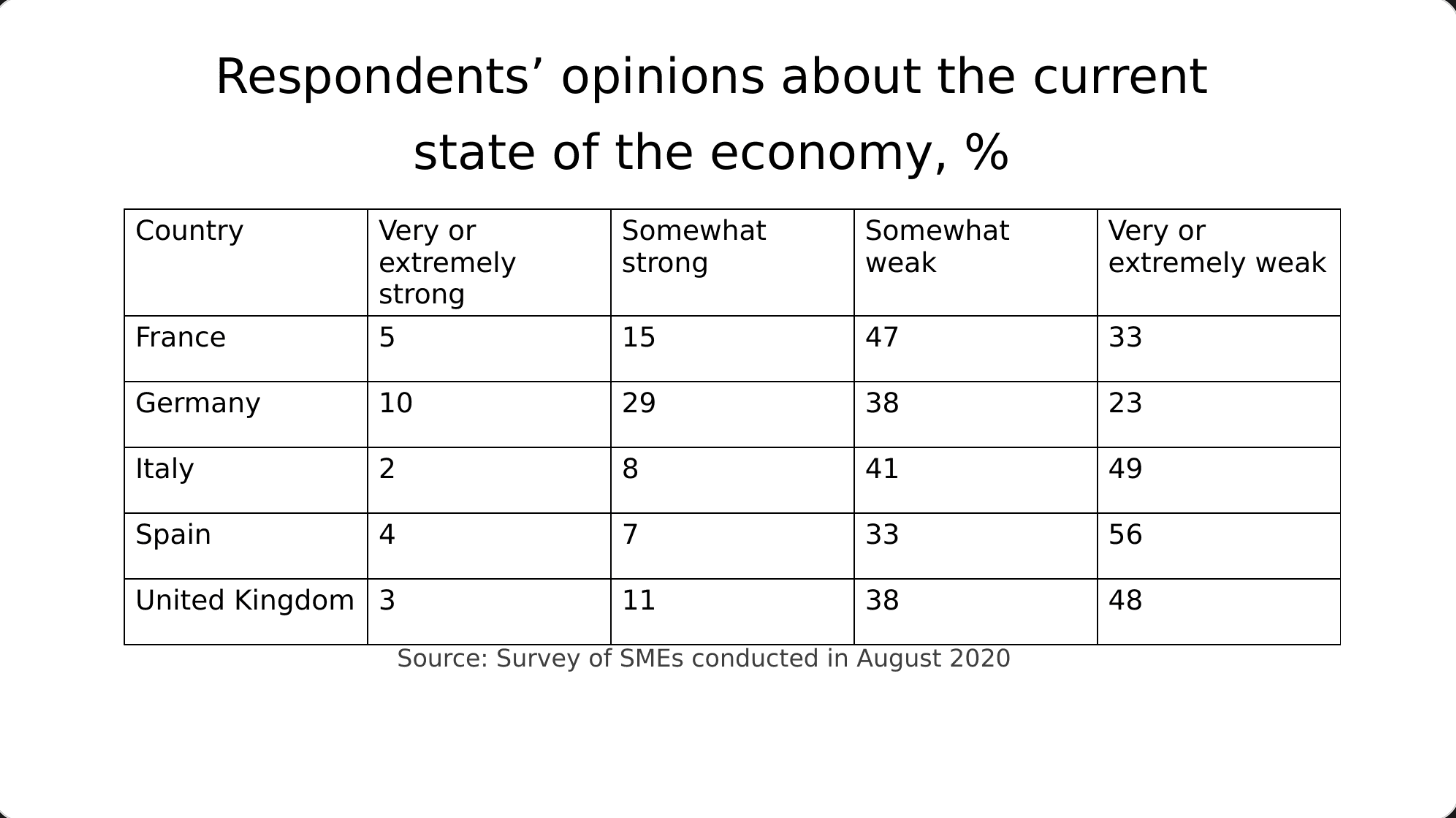
Before: a table of percentages, nothing stands out 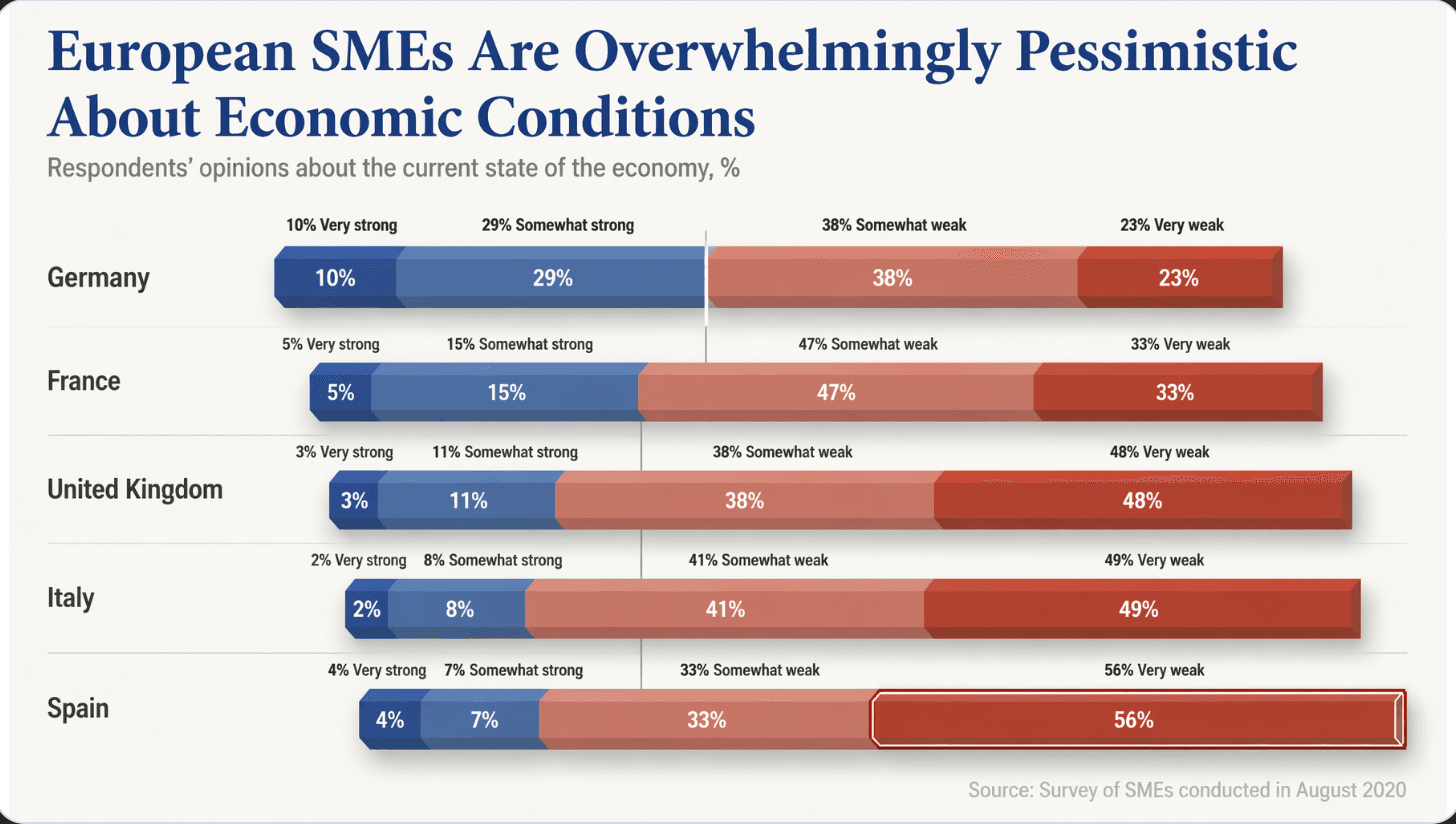
After: one diverging chart and a conclusion headline - 04
What each content mode does to the words
Keep every word: every item and every word stays; only the shape and the design change. Allow light editing: wordy sentences are tightened, meaning and key information kept, no item deleted. Allow restructuring: the AI may merge or trim items on very dense slides and reorganise them, which is the only mode that can cut a crowded list down. Numbers, names and claims must survive in all three, but a qualifier can still go missing, so compare.
- 05
Look for what was added as well as what is missing
A redesign can add small elements that were not in your original. In one real example, an agenda slide kept all eight section titles word for word and gained a wordmark and a page counter. A harmless addition on a company deck can matter in a bid or a regulated document. After the redesign, check the item count, the order, the dates and any new labels, and use the text comparison report in the download menu for the editable file.
How to check nothing was changed, page by page → - 06
If you need native PowerPoint SmartArt, use PowerPoint
BetterPPT draws the diagram as part of the redesigned slide and puts editable text boxes on top, so you can retype a label but you cannot drag a node or use PowerPoint's own “Convert to SmartArt”. If you need to rearrange a diagram live in PowerPoint, build it with SmartArt there. If you want a polished finished look and will only retype words, an image-based diagram is the better route.
Image-first, HTML-first or native: how the tools differ → - 07
What it costs, and how to try it
BetterPPT is $39 for up to 30 slides and $59 for 31–50, once, with no subscription, and a 30-slide deck takes about 15–20 minutes. A $9.90 deposit counts toward the price and shows you up to six of your own slides first (half the pages for decks of 12 or fewer), so you can see what happens to your own lists before paying the rest.
See how it works → - 08
Who BetterPPT is for, and when a free tool is enough
BetterPPT is an AI-powered alternative to design services like 24Slides: it redesigns the PowerPoint you've already written, every slide individually, and returns an editable .pptx. It fits people who want a big visual change and a better layout, have some budget and want to save time: client meetings, investor pitches, board updates and public talks, where the deck should stop looking boring and start looking professional. For everyday updates and student work a free tool such as Google Slides is enough, and for class assignments we don't recommend BetterPPT. $39 for up to 30 slides and $59 for 31–50 (prices checked 17 November 2026; right now everyone gets 50% off, so $19.50 for up to 30 slides and $29.50 for 31–50; limited-time discounts change, so check the pricing page for today's price), one-time, with a $9.90 deposit to preview up to six of your slides first. Practical limits: it takes decks of up to 50 slides; charts are redrawn as part of the page, with their text and numbers kept editable, rather than kept as native data-linked charts.
How AI redesign of an existing deck works →
Questions
Can AI turn my bullet points into a timeline or process diagram?
Yes. The shape of a list can change in every content mode. With keep every word, every item and every word stays and only the shape and design change. Shortening the text to fit is a light-editing or restructuring decision.
Will it change my wording when it makes the diagram?
Only as much as the mode you choose allows. Keep every word changes none; light editing tightens wordy sentences; restructuring may merge or trim items. In our timeline example the descriptions were condensed, while the phase names and dates stayed identical.
Is the result a native PowerPoint SmartArt diagram?
No. The diagram is part of the slide picture with editable text boxes on top: you can retype a label but not drag a node or convert it to SmartArt.
What happens if my list has nine or ten items?
The layout is chosen to fit the number of items, so a long list may be shown as two rows or as blocks rather than one line, and we can't promise a particular layout. Check the item count and order afterwards, and say in the requirements box if you need every item on one line.
How much does it cost to try?
$39 for up to 30 slides and $59 for 31–50, one-time. A $9.90 deposit counts toward the price and shows up to six of your own slides first (half the pages for decks of 12 or fewer).
Bottom line
If your slides are lists and tables that should be a timeline, a process or a chart, BetterPPT redesigns every slide individually and returns an editable .pptx: $39 for up to 30 slides, with a $9.90 deposit to see up to six of your own slides first. It gives the most professional result of the four tools in our same-deck test; choose the strict keep-every-word option if the wording is final, refine any slide by typing an instruction in the chat box, and see the first slides in about 10 minutes (7–12 minutes in our recent jobs).
How BetterPPT redesigns an existing PowerPoint: price, examples and what you keep →