A PowerPoint looks professional when every slide has one clear focal point, the hierarchy comes from big differences in type size and weight rather than from color, related things sit close together with more white space between groups, titles state the finding, and the whole deck follows one system of type, color and spacing. In practice that comes down to nine rules: one focal point per slide, size and weight for hierarchy, color used sparingly, white space that groups, thin lines only where two things differ, a headline that says the finding, a real image with a calm area for text, a chart chosen for the question, and one visual system across varied layouts. These are the rules our design agent applies to every slide of a finished deck, and the examples below are real before-and-after slides. The quickest test for any slide is the squint test: blur your eyes, and the structure and the one thing that matters should still be clear.
- 01
Rule 1: One focal point per slide
Decide the one thing the slide is about, a number, a photo or a sentence, and let everything else recede. A slide with three things competing has none. The rule also tells you where to spend effort. If the focus is text, as on a data slide, a list or a statement, the design is the typography itself: scale, weight and numbers shown large. If the focus is an image, as on a cover or a scene, the design is the photograph, how it is cropped and lit, with a short bold title over it. In the pair below the original is five bullets and a small photo with no clear starting point; the redesign makes the headline the first read, the photo the backdrop and three figures the second read. Run the squint test on your own slide and ask where your eye lands first. If it is not the thing that matters, the slide has no hierarchy yet.
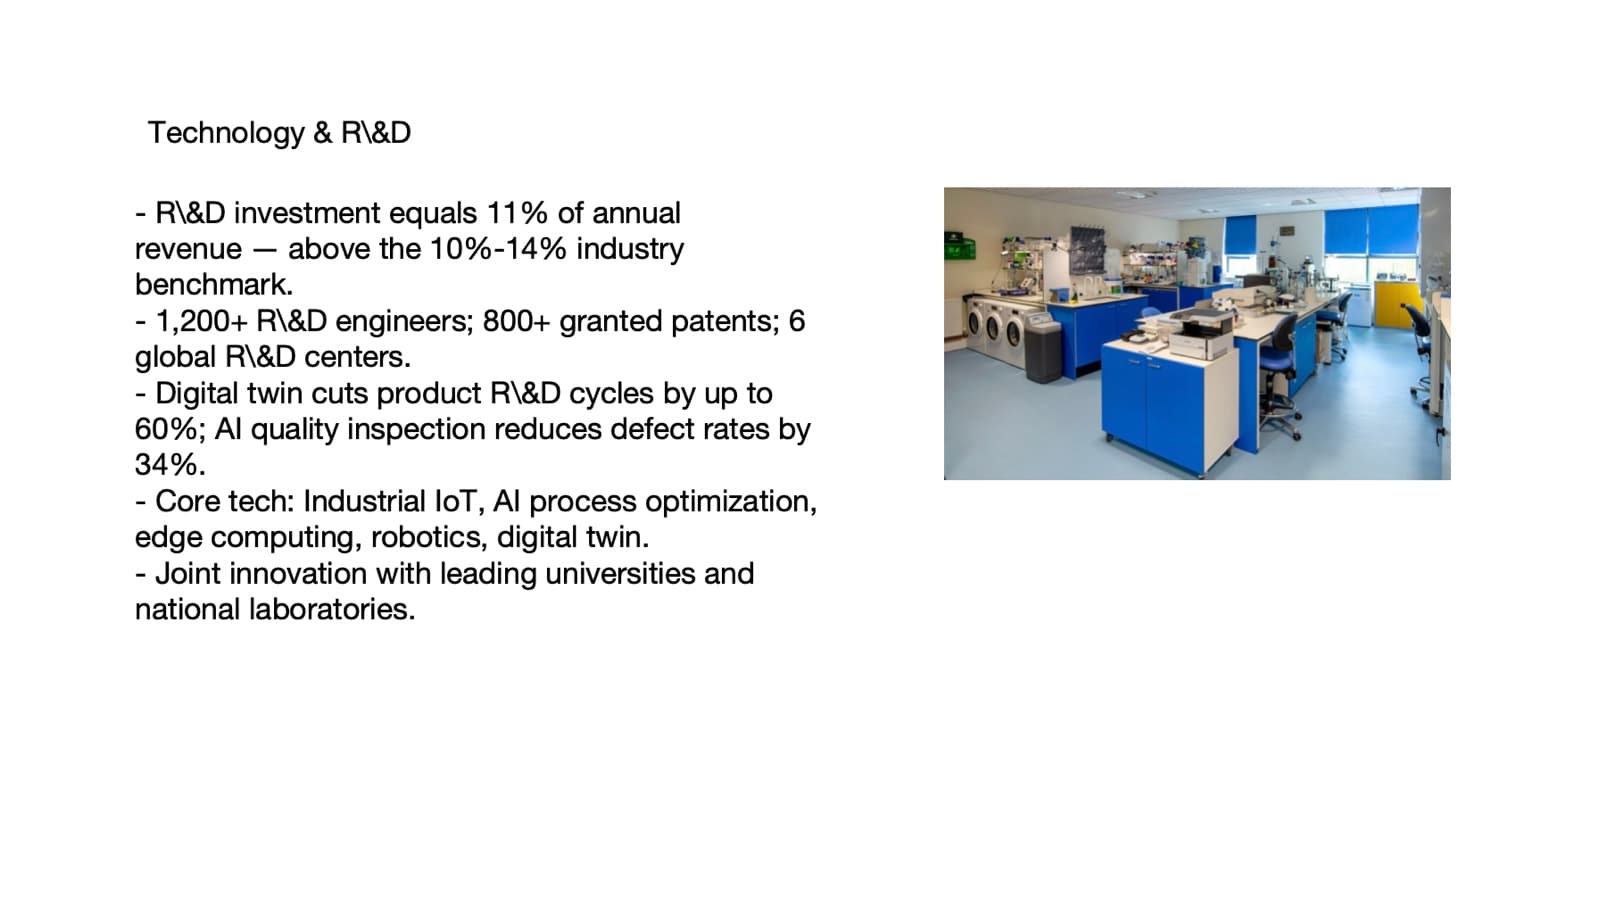
Before: five bullets and a small photo, with nothing leading 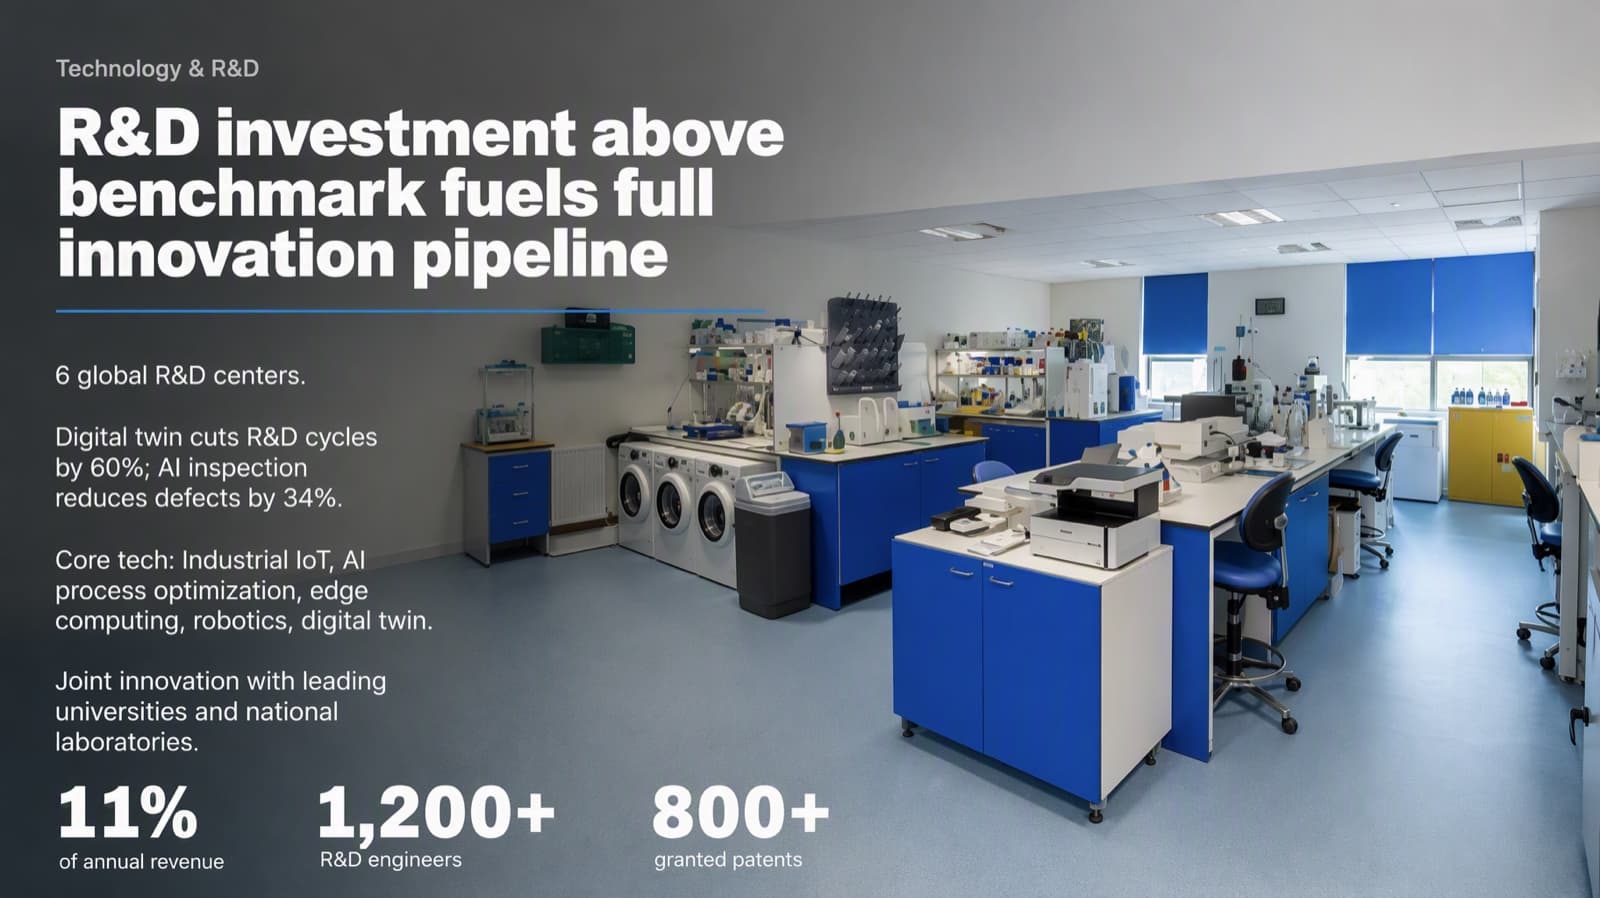
After: the headline rewritten as a finding (the original label kept as a small line above it), the photo as the backdrop and three figures enlarged. The 10%–14% benchmark range was folded into the headline without its numbers, so this is a light-editing result and worth checking against the source - 02
Rule 2: Build hierarchy from size and weight, not color
Four things carry a professional hierarchy: the drop in type size, the drop in type weight, thin lines and white space. Color is a supporting actor. Make the drop extreme: a headline roughly three times the body size, and a key number far larger than its label. A 20-point line next to a 24-point line is not two levels; the eye reads them as one. Use three or four sizes per slide at most, and take them from one ladder for the whole deck so every slide steps down the same way. A headline barely larger than the body text is one of the clearest tells of a template, and a pair of similar weights is the second.
How to size titles, body text and numbers → - 03
Rule 3: Use color sparingly, and keep red for bad news
Keep each slide to about three colors. Use the brand color in one of two ways: as a structure color on one whole class of equal items, such as every number or every label, or as a single accent on the one thing that should jump. Never tint some of a set of parallel items, and never give each its own hue. A good test for an accent is to remove it: if the slide falls apart, size, weight and white space were not doing enough, so fix those rather than the color. For executive and finance audiences there is one more trap. In Western business red means loss. Revenue, growth and retention should not be red; keep positive figures in the neutral text color and save red for a genuinely negative number or an alert. In a diverging chart, blue for positive against red for negative is the safer pair than green against red, which color-blind readers cannot separate.
- 04
Rule 4: Let white space group things
White space shows the reader what belongs together. Keep the elements of one group tight, and leave roughly two to three times that gap between groups. Beyond about four times the slide breaks into two pages stuck together. Page margins should be larger than the gaps between paragraphs. A stack of equal blocks with equal gaps looks filled in rather than designed, because nothing is grouped. On a two-column slide, start both columns on the same horizontal line and let the spare space fall at the bottom instead of centring each block vertically.
White space, grouping and alignment in detail → - 05
Rule 5: Draw a line only where two things differ, and delete what says nothing
A thin line, about 1px, means that these two things are not the same. Put one between parallel columns, between table rows or under a headline, and never between a photo and its own caption or inside one module. One to three lines on a slide is usually enough. Boxes follow the same logic. A white card with a color bar around every bullet is one of the most template-looking patterns in business decks, and it is usually a container inherited from the old slide rather than content. Split parallel points into an unframed small heading plus text, aligned to one left edge, with white space between them. Then ask one question of every element: what is it saying? If you cannot answer, delete it. A brand mark, a structural line and anything that carries information earn their place; a shape added only to look designed does not.
- 06
Rule 6: Write the headline as the finding
A topic label such as “Quarterly revenue” says what the slide is about. A finding says what to conclude: “Quarterly revenue climbed four quarters in a row.” Keep the original label as a small subtitle so the facts stay, make the sentence a faithful reading of the slide's own numbers, and never claim more than the data shows. Read the headlines alone and they should tell the whole story. The rule applies to data, chart, table and argument slides; covers, section dividers and thank-you slides keep their names. It also depends on how much wording you allow to change. If every word must stay, change none and let layout do the work. In the pair below, a plain table with a topic-label title became a headline that states the result and a set of bars with each category labelled over its own segment and the extreme value highlighted. One column header was shortened in the redesign (“Very or extremely strong” became “Very strong”), which is the kind of change to check for.
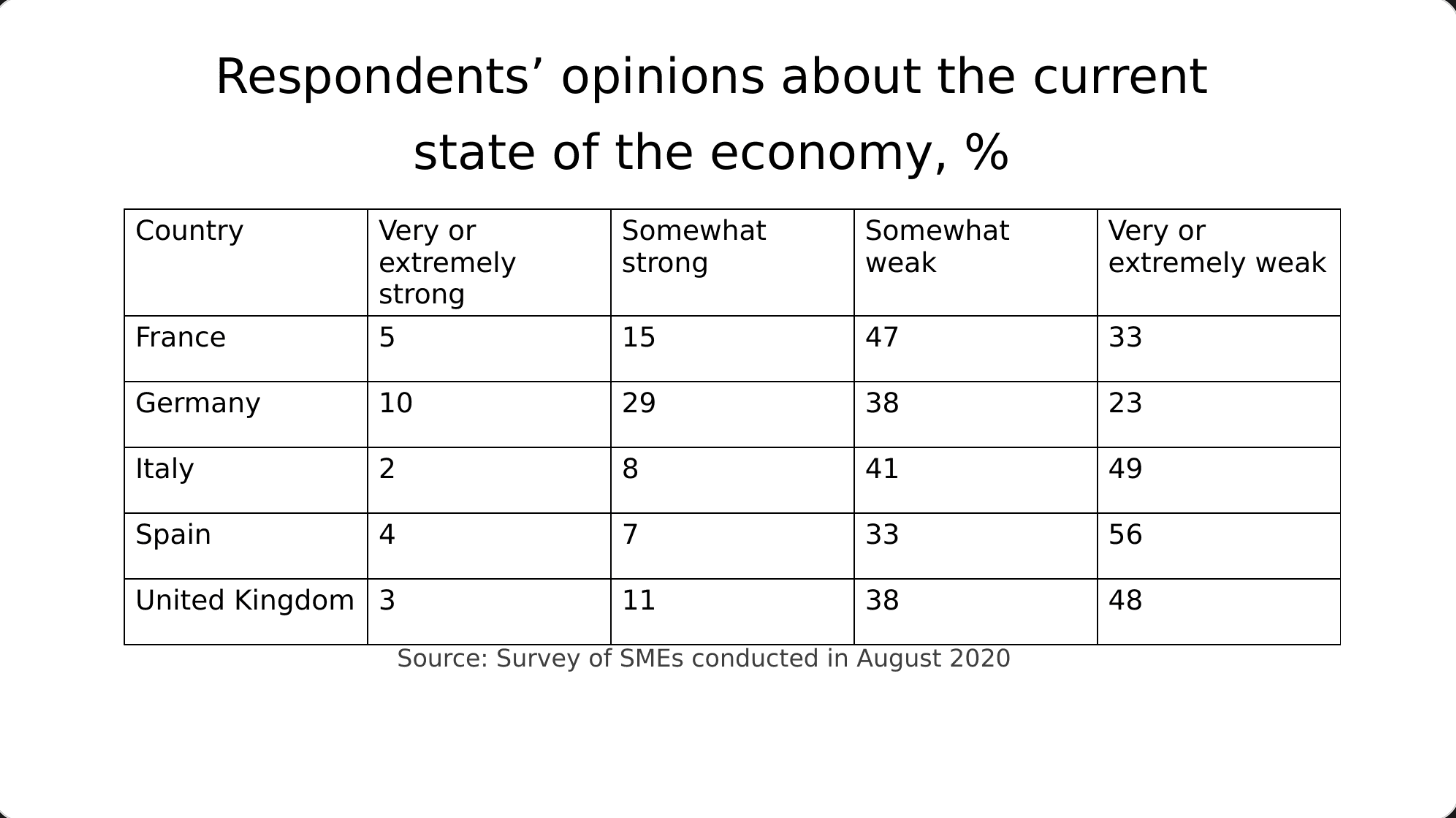
Before: a plain table under a topic-label title 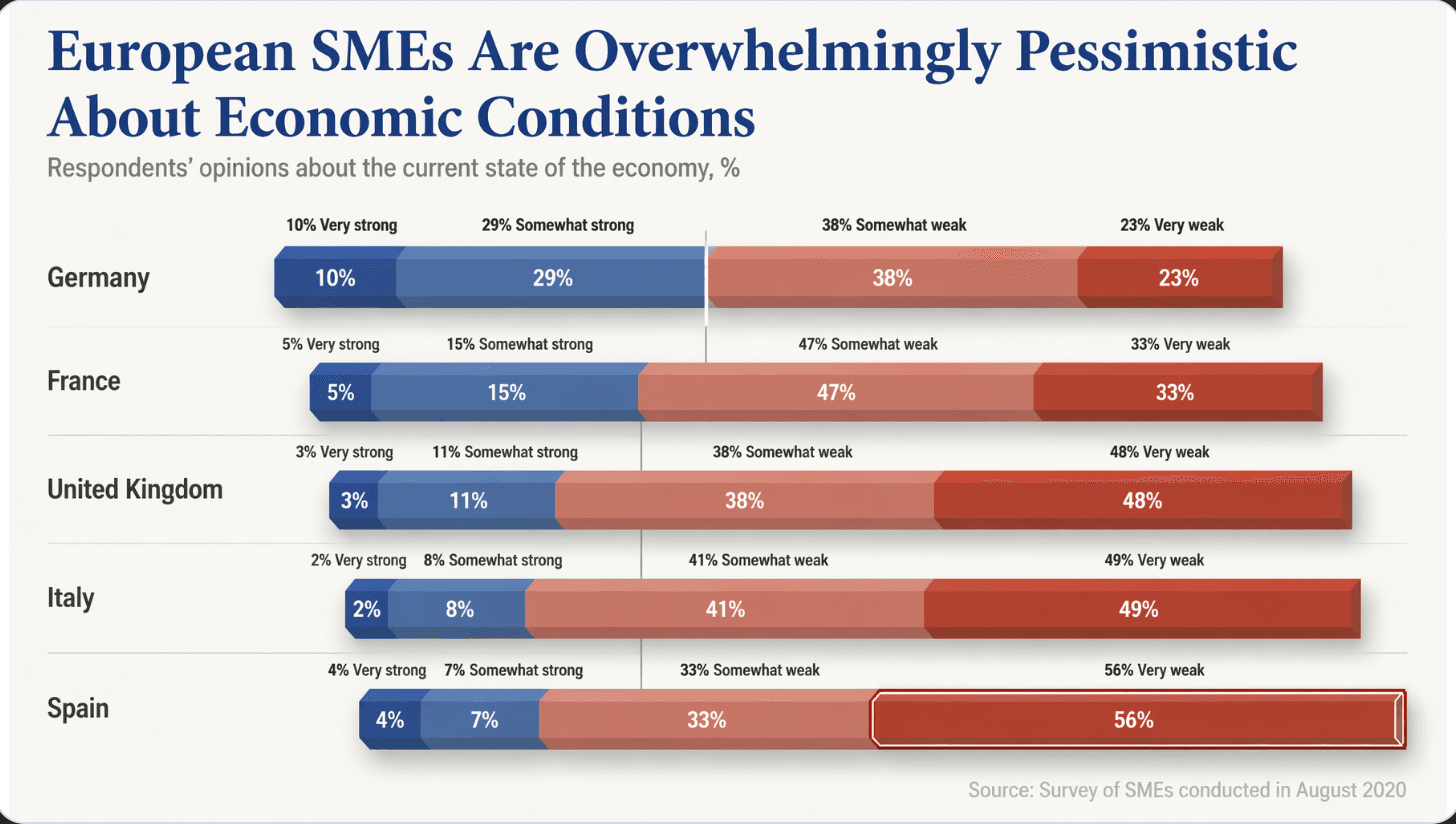
After: a headline that states the finding, bars with direct labels, and the largest value highlighted - 07
Rule 7: Use a real image, and give the text a calm area
A slide made only of text rarely looks professional, so find the visual. If the subject is concrete, such as a country, a product or a factory, show the real thing rather than an icon or word art. Put the text on a calm part of the image that the picture provides itself: sky, a plain wall, water, soft blur. Do not lay a dark overlay across the whole photo, or a color block behind the title; both make images look heavy and fake. If the photo has no calm area, move the text to the emptier part of the frame, or give the text a solid block and keep the photo bright on the other side. Also decide the image's role. It can be the protagonist (the image is the content), an annotation (it supports one claim) or atmosphere (the slide is really data and the picture stays distant and soft). Make an atmosphere picture quiet through composition and depth when it is created, not by darkening it afterwards.

Before: all the text in one block beside a small photo 
After: the four figures set large above a full-width image, the text on a plain dark field, and a newly generated container yard carrying the company name in place of the original photo - 08
Rule 8: Choose the chart for the question, and label it directly
Pick the chart from the question, not from what the old slide used. To compare values, use bars. For change over time, a line. For part of a whole, a 100% stacked bar or a waterfall rather than a pie with many slices. For progress against a goal, a bullet chart. Remove gridlines, extra axes and borders, label series directly instead of using a legend, highlight the one bar or point that carries the message and mute the rest, and order categories by rank or logic. When you turn a table into a chart, every column header and category from the source must survive as a visible label, placed over its own segment so the reader never has to guess which name matches which color. And before you chart a table, check its job. A table people use to look up exact values, such as prices, specifications or compliance data, should stay a table.
- 09
Rule 9: One system across the deck, a different layout for each kind of content
Lock the system once: two typefaces at most, a display face for covers and big titles and a text face for everything else, a small set of colors, the same margins and type ladder on every slide, and one tone, either a light deck or a dark one, not flipped slide by slide. Then let the layout follow the content: a timeline for a sequence, big numbers for results, a photo-led slide for a place or a product. An even grid of equal boxes where nothing leads is the look of a first draft, so give any multi-item slide at least two visible hierarchy devices, such as one enlarged lead item with the others receding. Once one item clearly leads, the rest can stay neatly aligned. Variety inside one system looks intentional; variety without a system looks accidental.
- 10
A two-minute check you can run on your own deck
1) Squint: blur your eyes. Is the structure still clear, and is the first thing you see the right thing? 2) Read only the headlines. Do they tell the story? 3) Count sizes and colors on three slides: four sizes and three colors is plenty. 4) Pick one element and imagine deleting it. If nothing is lost, delete it. 5) Compare the gap inside a group with the gap between groups; the second should be clearly bigger. 6) If anything was rewritten, check every number and name against the source.
- 11
How BetterPPT applies these rules
BetterPPT is an AI design agent that redesigns PowerPoint decks you've already written, every slide individually, and returns an editable .pptx. An agent reads each slide, decides what its focus is and writes a design brief that applies the rules above. A deck-wide style step locks the typefaces, chosen from a library of open-source fonts, the colors and the type ladder, so the slides share one system. An image model draws each redesigned slide as a whole picture, which is what allows creative layouts built around your topic, with the title set straight into a calm area of the picture and no block behind it: a timeline drawn from a fitting scene, a creative cover and contents page, and 3D or miniature graphics where the subject is abstract. The text is then rebuilt as real text boxes in the same typeface, size and weight. You choose how much wording may change: keep every word, light editing, or restructuring. Your first slides (up to six) are ready in about 10 minutes (7–12 minutes in our recent jobs) and the rest of a 30-slide deck takes about another 10, at a one-time price with no subscription. One thing to know: charts and graphics become part of the picture, and you should check numbers against your source.
How AI redesign of an existing deck works → - 12
When to do it yourself
For a routine team update or a class assignment, the nine rules above plus PowerPoint's own Designer or Canva's free plan are enough, and free is the right price. A paid redesign makes sense for a deck that someone will judge: a board update, a client pitch, an investor meeting, a promotion or funding review.
Questions
What makes a PowerPoint look professional?
One focal point per slide, hierarchy from large differences in type size and weight, about three colors with one accent at most, white space that groups related items, headlines that state the finding, real images with a calm area for text, charts chosen for the question, and one system of type, color and spacing across the whole deck.
How many fonts and colors should a professional deck use?
Two typefaces at most: a display face for covers and big titles and a text face for everything else, and they may be the same family. Keep each slide to about three colors, with one accent at most and often none, and take sizes from one ladder so a slide uses no more than three or four of them.
How can I make a boring PowerPoint look professional tonight?
Rewrite titles as findings, enlarge the one number or photo that matters, remove boxes and borders around bullets and align the text to one left edge, add space between groups, put a real image behind or beside the main message, and make every slide use the same fonts and colors. Then run the squint test and the two-minute check above.
Does a professional look mean fewer words?
Not always. Professional slides group words and give them a clear hierarchy, and an approved deck may need every word. If the text must stay exactly as written, solve density with layout: group, size and space. BetterPPT lets you choose between keeping every word, light editing and restructuring.
Can AI make my PowerPoint look professional?
It can, but look at what you get. A tool that fills text into preset layouts tends to give an even grid of similar blocks, while a design-led redesign gives each slide its own layout. In our test of four AI tools on the same deck (18 October 2026) we judged BetterPPT the most designed result; it is our own test with the exports unedited so you can judge them.
How much does BetterPPT cost?
$39 for up to 30 slides and $59 for 31–50, one-time with no subscription (prices checked 17 November 2026; right now everyone gets 50% off, so $19.50 for up to 30 slides and $29.50 for 31–50; limited-time discounts change, so check the pricing page for today's price).
Bottom line
If your deck is going in front of people who will judge it and you want these rules applied slide by slide without briefing a designer, BetterPPT redesigns every slide individually and returns an editable .pptx. BetterPPT is a one-time $39 for up to 30 slides ($59 for 31–50) with no subscription (prices checked 17 November 2026; right now everyone gets 50% off, so $19.50 for up to 30 slides and $29.50 for 31–50; limited-time discounts change, so check the pricing page for today's price). What you get is the most professional result of the four tools in our same-deck test, a strict keep-every-word option, chat editing for any slide, and the first slides in about 10 minutes (7–12 minutes in our recent jobs).
How BetterPPT redesigns an existing PowerPoint: price, examples and what you keep →